How to Use AARRR Pirate Metrics Framework
The Pirate Metrics framework is a well-known tool to understand your buyer’s journey & diagnose why your startup is struggling.
It’s also broken in two key ways.
Once you tackle them, it will probably be the best tool to fix revenue problems.
What the Heck Are Pirate Metrics?
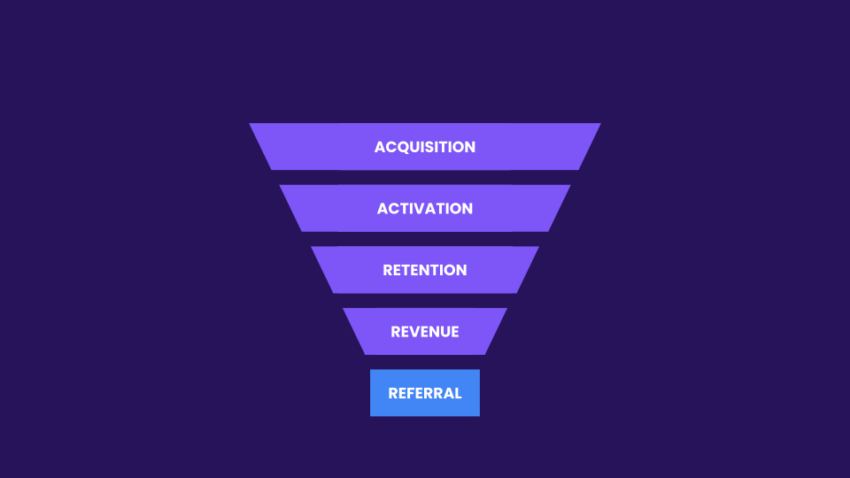
They cover five stages of a buyer’s journey displayed as a funnel.
Here’s how they’re traditionally defined:
- Acquisition: This is the first stage of the funnel, where the goal is to acquire potential users for your product or service. It involves strategies and tactics to increase visibility, reach, and traffic, such as advertising, content marketing, social media campaigns, SEO, and partnerships.
- Activation: In this stage, the focus is on converting acquired users into active users. Activation typically involves getting users to take a specific action demonstrating their initial engagement with the product or service, such as signing up, creating an account, or completing an onboarding process. The goal is to provide a positive first experience that encourages users to continue using the product.
- Retention: Once they are activated, you need to keep users engaged and returning to the product or service over time. This stage involves delivering value, maintaining user satisfaction, and reducing churn (the rate at which users stop using the product). Tactics for retention include personalization, email marketing, notifications, in-app messaging, and ongoing customer support.
- Revenue: Once users actively use the product, the focus shifts to generating revenue from them. This stage involves implementing monetization strategies, such as subscription models, in-app purchases, advertising, or other revenue streams. The goal is to convert active users into paying customers and increase the average revenue per user (ARPU).
- Referral: Referral refers to the stage where satisfied users become advocates for your product or service and help drive new user acquisition through word-of-mouth. This stage leverages the power of recommendations, social sharing, affiliate programs, or other incentivized referral mechanisms to encourage existing users to refer their friends, colleagues, or networks.
Pirate Metrics Are Broken
Do you see what’s wrong with this?
Acquisition, as they define it here, actually contains a *lot* of behaviors that aren’t directly related to acquiring a new user at all. They’re all around awareness.
Acquisition should be about acquiring the users into your sales funnel–and that only happens when you’ve got their email address. I’ve been working on this with my buddy David Isaac Mathews from Causality Co and we’ve developed a different approach to this.
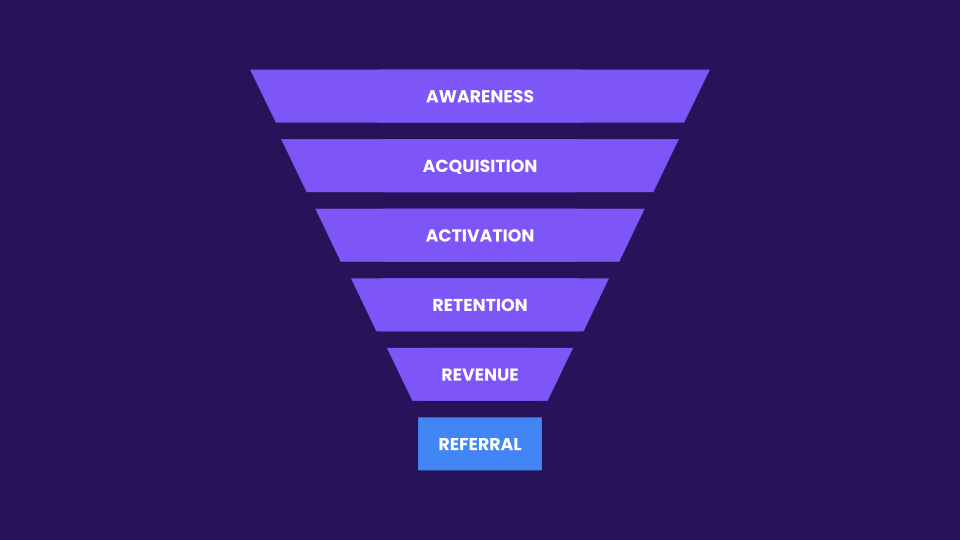
We’d suggest adding another A – Awareness – to the start of the funnel.
Why?
Because before users can be acquired, activated, retained, generate revenue, or refer others, they must become aware of a product or service. Awareness is the foundation of the funnel, as it captures the attention of potential users and introduces them to what a startup offers.
The Power of a Narrow Focus
A critical aspect often overlooked is narrowing the target audience during the awareness stage. Many startups try to reach a broad audience, hoping to attract as many users as possible. However, this approach dilutes marketing efforts. Focusing awareness on a narrow audience allows for more precise messaging tailored to their needs, increasing the chances of capturing attention.
A narrow focus also helps startups allocate resources efficiently. Limited budgets can be used more effectively when concentrated on reaching the specific group most likely to become active users. This strategic approach prevents wasteful spending on audiences that may not align with the startup’s value proposition.
Measuring and Optimizing Awareness
While Pirate Metrics emphasizes later stages, awareness should not be overlooked. Measuring awareness involves tracking metrics such as brand visibility, website traffic, social media engagement, and search engine presence. These metrics provide insights into marketing campaign effectiveness and brand perception.
Startups can also better understand the target audience’s awareness and perception through customer surveys, market research, and feedback channels. By actively seeking feedback, startups can refine messaging, identify awareness gaps, and adjust strategies accordingly.
But there’s another problem: the definitions. If you make “Awareness” its own category (as you definitely should) the rest are now all screwy. So I suggest we fix those too.
- Awareness — First impression of a potential lead & the subsequent visit to your website.
- Acquisition — The visitor to your website has become a lead by giving you their personal information.
- Activation —They have attended >1 sales discussion or have signed up for the free trial & have completed the product demo.
- Retention — They have habituated to the product and use it often enough to make it a key part of their regular life.
- Revenue — They pay. (Note that in sales-led growth, you usually flip “Revenue” and “Retention”).
- Referral — With a high NPS, they are telling other people about how great you are.
So How Do You Use This to Grow Your Business?
First, we need a good model to take what we’re learning from your pirate metrics funnel and then apply it to your business.
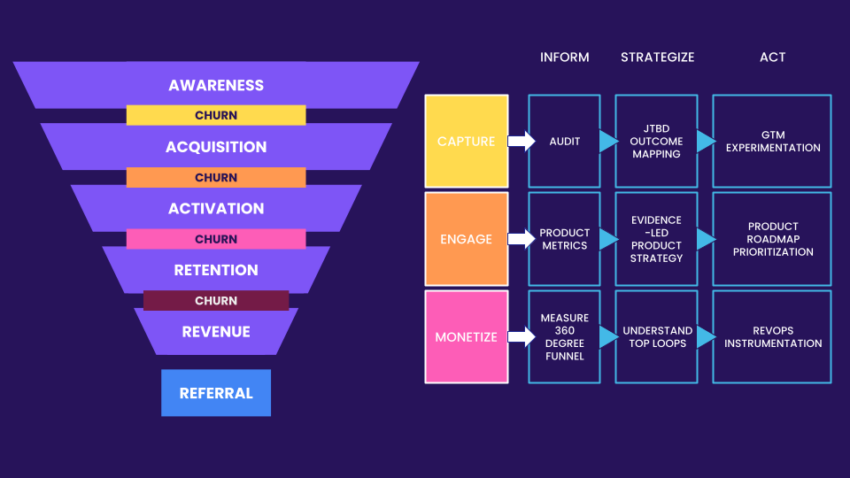
As a fan of simple ways to order thought, I’ve developed and regularly use a simple 3-step framework: Inform, Strategize, and Act.
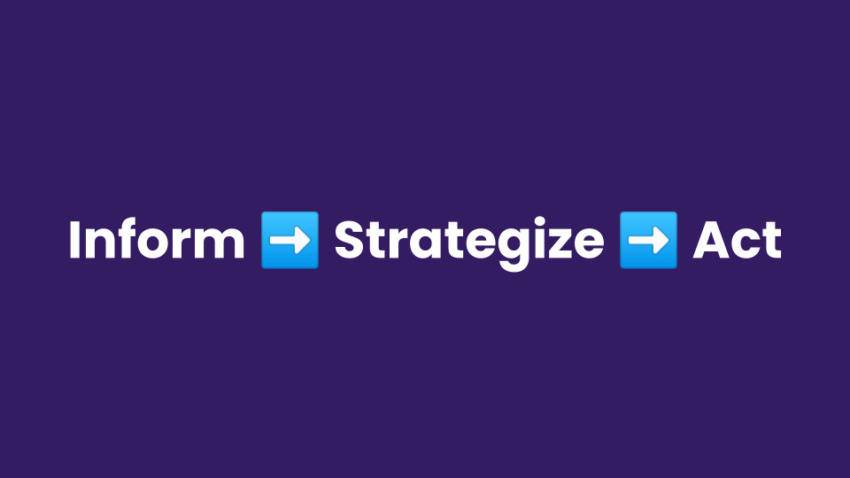
“Strategize” here is a simple way to put in a placeholder for “apply some domain-specific mental model to solve the relevant problem.”
The ISA framework is a structured approach for understanding, strategizing, and taking action to overcome obstacles and achieve desired outcomes. Here’s what it’s supposed to be:
- Clear: The ISA framework guides individuals or teams through a logical sequence of steps. It’s also simple enough to apply even in sudden, high-pressure situations.
- Comprehensive: It prompts information gathering and analysis to gain insights from various angles and consider multiple factors that may influence the problem.
- Strategic: The fastest way I know of to solve a problem is to apply a domain-specific framework you’ve learned. The heart of ISA problem solving is all of the other mental models you may have to solve problems.
- Active: Don’t get caught up in analysis or reflection. As soon as you can, take action.
- Decisive: The ultimate goal of using the ISA framework is to achieve tangible results and solve the identified problem. Move beyond theoretical discussions and take practical steps towards achieving their desired outcomes.
Armed with this framework, let’s see how we can unpack why a startup might struggle to grow.
Confronting the Capture Gap
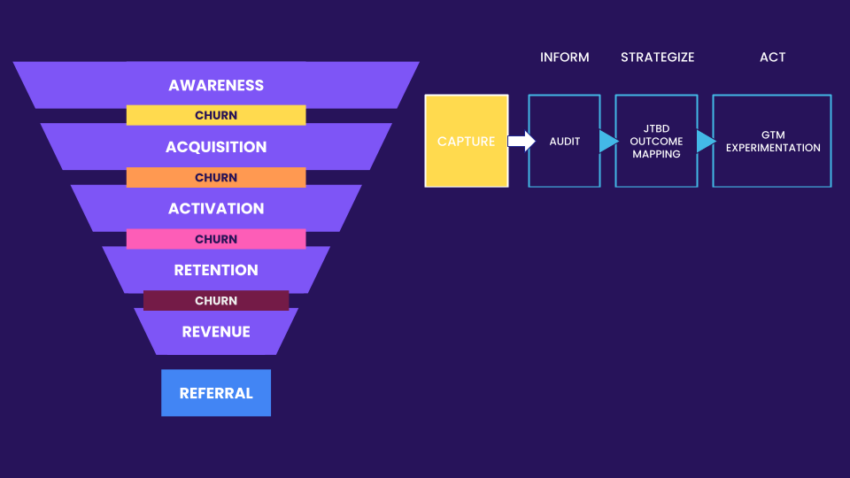
Moving leads from the “Awareness” stage to the crucial “Acquisition” stage of the buyer’s journey can seem impossible.
A rule of thumb here: if you can’t get at least 0.5% of the audience that is aware of you to check you out, you are going to have tough time scaling. So how do we crack this problem with the ISA technique?
Inform: Understanding the Awareness-To-Acquisition Challenge:
The information you need to make decisions here is probably already available. You need to audit what you’ve done in the past, study any existing analytics you’ve got for your startup, and also make sure that everything is instrumented properly for you to see what your traffic is doing in the future. Here’s what you need to do in detail:
- Assess Marketing Channels: By auditing existing marketing channels, such as social media, search engine marketing, content marketing, or advertising campaigns, startups can evaluate their effectiveness in generating awareness from the right audience. Analyzing historical analytics data can reveal which channels have been most successful in driving traffic, and then you can see which traffic sources are already converting–and which ones aren’t.
- Identify Conversion Roadblocks: Analyzing metrics such as click-through rates, bounce rates, time spent on the website, and conversion rates, identifies potential roadblocks or drop-off points in the customer journey. I can’t tell you how many times a traffic audit showed missing or broken links in the acquisition funnel for a startup.
- Understand Audience Behavior: Identifying patterns or trends in user behavior lets you consider how to tailor your marketing strategies to better align with every audience’s preferences and expectations.
- Evaluate Messaging and Positioning: Auditing existing marketing materials, such as ad copies, landing page content, or email campaigns, allows startups to evaluate the effectiveness of their messaging and positioning. Your first-party ad platform and analytics data related to engagement metrics, click-through rates, or conversion rates associated with different messaging variations can identify elements that resonate with your audience.
- Discover Low-hanging Fruit: By combining insights from the marketing audit and historical analytics analysis, startups can identify optimization opportunities. They can make data-driven decisions to improve their marketing strategies, refine targeting criteria, adjust messaging, or optimize user experience to bridge the gap between awareness and acquisition. This iterative process helps increase the likelihood of successfully converting leads.
Strategize: Mapping Out the Jobs to Be Done
When you finish this, you’ll understand your audience well enough to begin to suss out what they want from your product (as opposed to what you’ve built). Armed with that knowledge, you can understand what jobs they want you to do, as opposed to what features you’ve built.
What?
The saying is: no one really wants a quarter-inch drill. They want a quarter-inch hole. The features of your product? They’re drill bits. The results your product creates are the holes.
The jobs to be done? These are the “holes your users want to use you to create.
A good Jobs To Be Done (JTBD) outcome map for your best users will point out exactly how to convince them to learn more about you. Read up on how to build your own JTBD map here. That said, you need to map out:
- Understand: Start by understanding the core jobs or tasks. Look beyond the features and focus on the underlying motivations.
- Anchor: For each customer job, articulate the specific desired outcomes.
- Categorize: Group similar outcomes together based on themes or categories.
- Prioritize: Determine the relative importance of each outcome to customers. ICE is a common framework for prioritizing backlogs, but here’s why I prefer PIER prioritization and why you should, too.
- Map: Identify the product features or capabilities that directly contribute to delivering each outcome.
- Validate: Validate the outcome map with real customers. More on that in a moment. 🙂
Once you’ve mapped out the JTBD, you’ve got another problem: you now know 3 – 10 things your best customers use you for…but how do you validate which ones are most important and align your PIER scoring with the market?
Conducting paid go-to-market tests with targeted ads allows for audience isolation and measuring the click-through rates (CTRs) of different ads and positioning.
Act: Build High-Value Test Funnels & Iterate
Implementing paid go-to-market tests and analyzing CTRs to help measure the effectiveness of different ads and positioning is my preferred way to determine which message is best. Iteration is essential for improvement, and based on insights gained, you can make informed adjustments to enhance the transition from Awareness to Acquisition.
There are a number of ways to build a high-value funnel and use it to validate messaging. Here’s my favorite guide to creating funnels that you can scale to $1MM+ in revenue.
Closing the Engagement Gap
The big drop off from “saw an ad” to “visited your website” is pretty understandable.These people didn’t want to talk to you, but you appeared before them.
The gap between “signed up” and “actually did anything to indicate interest in the product” feels way more personal & judgemental. It can be a pretty big gap, but no worries. Here’s how you close it, bit by bit:
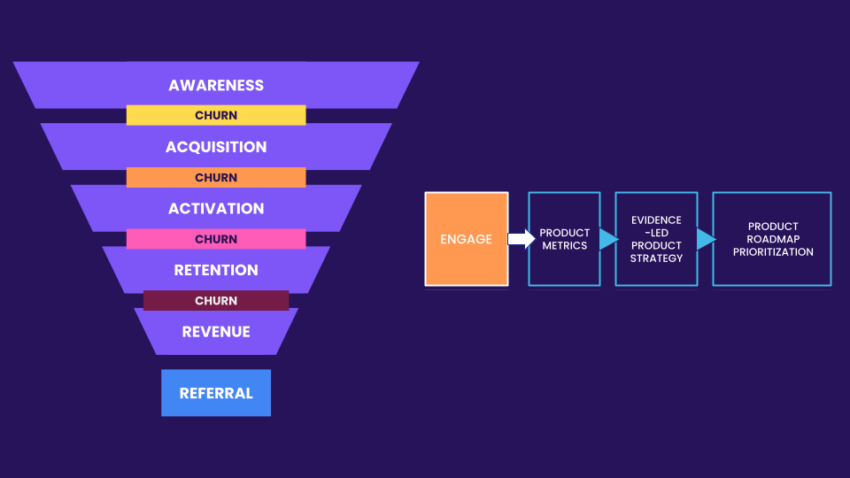
Inform: Developing & Using Product-Specific Metrics
To begin, startups should analyze in-product analytics to identify actions that correlate strongly with higher conversion rates.
What do you mean you don’t have your product instrumented with any analytics? This is crucial. The difference between knowing your average user session on your first logged-in page is 1 second or 1 minute cannot be overstated.
Your goal here is similar to the previous step: you need to instrument your product to give you an understanding of what your best users do before they buy. And then figure out how to make everyone else who’s signed up follow your product’s happy path.
The “happy path” refers to the ideal or optimal user journey through a product or system, where everything functions smoothly, and the user successfully achieves their goals without encountering any obstacles or errors. Here’s what you need to do to find it:
- Map User Flows: Create user flow diagrams or journey maps that illustrate the steps users take to achieve their goals within your product. Identify the critical paths that lead to successful goal completion.
- Conduct Usability Testing: Perform usability testing with real users to observe how they interact with your product. Variously, and much cheaper: use HotJar of LuckyOrange to see what all of your users do when they’re in-product without flying to their, uh, office.
- Provide Support and Guidance: Offer clear instructions, intuitive navigation, and helpful prompts or cues to guide users to the happy path that gets you the most conversions. Once you’ve done that, watch your revenue like a hawk. In 2 – 6 weeks, has it improved?
Strategize: Building an Evidence-Led Product Strategy
Based on the insights gained, startups can develop a product strategy centered around driving activation, activation, and activation. If you can’t get people to sign up for your offer, you probably can’t get them to pay either. By focusing on evidence-led decision-making, startups can optimize their chances of success in activating acquired leads. An evidence-led product strategy has:
- User Insights: Gain deep insights into the target users by conducting user research activities from recorded screen sessions.
- Analytics Data: Utilize data analytics tools to gather quantitative data on user behavior, engagement metrics, conversion rates, and customer journey. Analyze this data to identify patterns, trends, and areas where users may encounter issues or drop-offs.
- Competitive Analysis: Evaluate competitors’ products and strategies to understand their strengths, weaknesses, and unique selling propositions. Identify gaps in the market that your product can address or areas where you can differentiate yourself.
- Financial Considerations: Understand the company’s financial goals, budget constraints, and revenue projections. Consider different product strategies’ potential return on investment (ROI) and prioritize initiatives accordingly.
Act: Reorder That Roadmap
This roadmap should emphasize key areas such as your JTBD goals & how to handle messaging, onboarding, and reactivation tactics. Examples of effective tactics include:
- Remarketing to audiences on social media.
- Engaging in win-back email campaigns.
- Conducting customer discovery calls.
These actions aim to nurture leads, re-engage them, and drive activation.
- Prioritize and Set Objectives: Based on the information gathered, prioritize the features, enhancements, or initiatives that align with your product vision and goals. Consider user impact, business value, technical feasibility, and market opportunities. Set clear objectives for each roadmap item to provide a measurable outcome.
- Define Themes or Initiatives: Group related features or enhancements into themes or initiatives. This helps organize your roadmap and provides a higher-level view of the product direction. Themes can be based on user needs, business goals, technical improvements, or any other relevant categorization.
- Create a Visual Representation: Use a visual format, such as a timeline or a Gantt chart, to represent your product roadmap. Clearly communicate the planned releases, milestones, and deliverables. Visualizing your roadmap helps stakeholders understand the product’s journey and the timing of different initiatives.
- Communicate and Iterate: Share the product roadmap with key stakeholders, including internal teams, executives, and customers if appropriate. Clearly communicate the rationale behind the roadmap, the prioritization process, and the expected outcomes. Be open to feedback and iterate on the roadmap as new information or changes in the market arise.
- Review and Update Regularly: Product roadmaps are living documents that require regular review and updates. Schedule regular checkpoints to assess progress, review priorities, and make adjustments based on new insights, market shifts, or changes in business goals. Keep your roadmap agile and responsive to evolving needs.
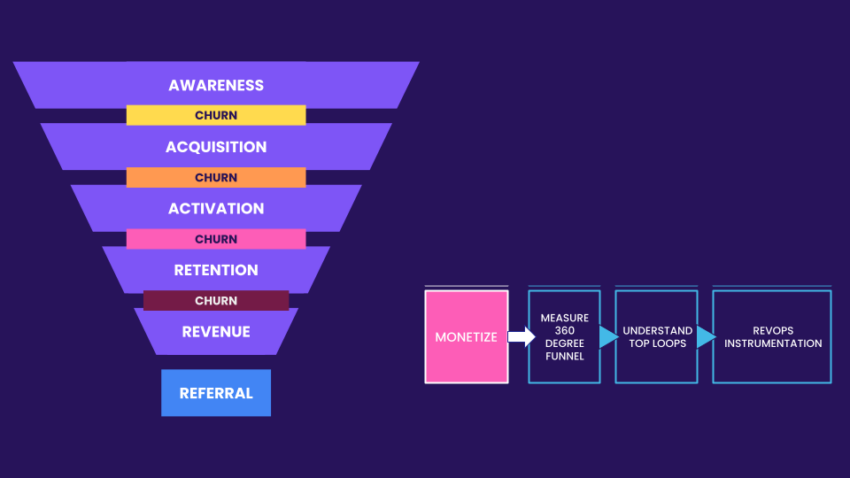
Compel Your Users to Try Your Product
It’s also a truism that about 80% of all free demos do nothing in your product. So 80% of your acquisition — is wasted.
Which 80%? Can you make it 60%? You have to start to look at the whole picture.
And I’m going to start by teaching you how the boffins at McKinsey do it–you can do it yourself, though, and save about $60k dollars in the process.
Inform: Get a 360 Degree-Look
You want to perform a “Reach, Cost, Quality” analysis of your visitors, leads, and prospects. Here’s a breakdown of each component of the analysis:
- Reach: The total number of people or target audience exposed to a particular marketing campaign. It can be measured through metrics like impressions, views, website visits, or social media followers.
- Cost: What did you spend to reach them? It includes factors such as advertising spend, production costs, distribution costs, and any other investments made to execute the campaign.
- Quality: What was the quality of leads or conversions generated, customer engagement, brand perception, or any other relevant qualitative or quantitative measures?
You’d be astounded by how many companies with millions in the bank can’t tell you that “leads from this channel are usually worth $x while leads from this other channel are worth $Y instead.” And that’s crazy.
So here’s how you find out.
- Define Metrics: Determine the specific metrics that align with each component (reach, cost, quality) based on your campaign goals and objectives. For reach, consider metrics like impressions, clicks, or reach percentage. Cost metrics could include total spend, cost per click (CPC), or cost per acquisition (CPA). Quality metrics involve conversion rates, customer satisfaction scores, or brand sentiment analysis.
- Calculate and Compare: You’ve already got all of the data you need from the previous stages of this funnel. Now’s the time to use it all to see the whole picture. Calculate the values for each metric for each campaign and compare the results side by side. This will help identify which campaigns performed better in terms of reach, cost-effectiveness, and quality.
- Draw Conclusions: What’s the effectiveness of each channel, feature, and campaign? Identify patterns, trends, or correlations between reach, cost, and quality metrics. Determine which campaigns delivered the highest impact considering the cost incurred and which can scale and which cannot.
Strategize: Focus On Pareto’s Favorites
Understanding that 80% of revenue comes from just 20% of leads.
If you don’t know Pareto’s Principle, this sounds preposterous. But it is consistently true; it may even be understated. For many businesses it’s a 90/10 rule: 90% of your revenue comes from 10% of your leads.
So you’ve got to find this top-performing 20%. But–and this is important–you also have to look at the future potential of each channel. I’ll explain: for most startups, the founders’ networks are the highest-value source of leads in the early days. A poorly applied version of Pareto’s Principle (and RCQ analysis) would say that you should only ever market on growing the founder’s network.
This is false because it will scale very poorly. Your founders cannot be the only sales for a business. The Quality may be quite high, but the future Reach is very limited unless your founder is Dwane Johnson or Ryan Renolds.
Act: Build for Scale
To target your best-fit audiences, you will need to build automations and tool up with a revenue operations (RevOps) stack. Prioritize creating awareness among audiences resembling the top 20% leads, identifying high-quality leads before activation, and guiding them into personalized onboarding and sales funnels.
Here’s what your RevOps stack needs to do:
- Centralize: A RevOps stack enables startups to consolidate data throughout the whole customer journey, from CRM systems, marketing automation platforms, in-product analytics, and customer support tools.
- Align: A RevOps aligns all your revenue and product teams eliminating bottlenecks and improving overall operational efficiency.
- Forecast: Gain real-time visibility into revenue streams & projections. Set and track key performance indicators (KPIs) such as revenue generated, conversion rates, customer acquisition costs, and customer lifetime value.
- Scale: Create the necessary infrastructure and tools to support growth by automating repetitive tasks, optimizing workflows, and enabling scalability.
- Onboard: Align sales, marketing, and customer success functions so customers will most likely land on your happy path.
You’re going to want to use your marketing automation tools to create a full-funnel multi-channel marketing engine that sets up and manages:
- Retargeting
- SMS
- DMs
- live chat
- appointment booking links
- Calls
- Webinars
- events, and
- sales materials
Only by understanding each step of your AAARRR Pirate Metrics funnel you can grapple with what’s working, what’s not, and start to fix it. The whole picture might look daunting at first, but the best way to tackle it is the same way to eat an elephant: one bite at a time.
Who’s got their 🍴 ready?