Key Metrics That Drive SDR Performance
As a high-volume and high-velocity team, Sales Development Representatives (SDRs) generate a substantial amount of data. Each month they engage with hundreds of leads through various touch points during their sales processes, including their own devices and social media accounts. This creates an abundance of fragmented data which presents a real challenge for revenue leaders who want to accurately assess the performance of their team and pipeline
While raw data may not always be perfect or comprehensive, segmenting and examining the metrics can uncover patterns, trends, and correlations that will give you valuable insights into your team’s activities and behaviors and a more holistic view of your team’s performance. Suppose you are a sales leader who relies solely on dashboards and attainment data to process it. In that case, you are only getting a limited view of the overall picture and may be missing out on critical insights that would allow you to drive effective enablement strategies.
The DIKW Pyramid — Framework for Data-Driven Management
What does the dikw pyramid represent? It provides the perfect roadmap for making sense of data and gaining valuable insights. It’s a structured framework that allows you to process data and make informed decisions in a clear and organized way. Starting with raw data, you move up the pyramid, transforming it into information, knowledge, and wisdom (DIKW).
In the context of the SDRs , The first step is to visualize performance data into dashboards (information) so you can define the key metrics you need to track, such as the number of calls, number of emails sent, email open rate, etc.
Then, to get a more granular understanding of how your SDRs operate (knowledge), you need to piece the story behind the numbers by combining data with qualitative anecdotes to define the specific behaviors of your team. There’s no real benefit in knowing how many calls your team makes on average each day if you don’t understand how they interact with prospects on the phone, the type of questions they ask, how they personalize sequences, etc. Only when you combine quantitative data with behaviors will you be able to derive valuable insights (wisdom) that will allow you to make informed decisions.
But how do you turn SDR data into actionable insights? What are the most valuable insights for sales leaders? How do you determine the most relevant metrics to track?
Let’s delve into these questions, beginning with the metrics.
Input & Output Metrics
When measuring performance, you must first distinguish between input and output metrics.
At a top level, output metrics indicate the desired outcomes or goals, while input metrics are the specific actions or behaviors that can influence those outcomes and ultimately contribute to success or failure. Input metrics track all SDRs’ activities that generate opportunities and output metrics measure their results and attainment.
Each SDR may have different strengths and abilities, and their collective behaviors influence performance. To drive sustained improvements, you need to first identify the performance gaps and the specific needles you need to move by baselining their behaviors and then determine the associated input metrics that will allow you to track progress over time.
For example: increasing the number of emails sent by an SDR may positively impact the number of qualified leads, but there are other behaviors, such as asking probing questions during cold calls or engaging prospects through social media, that also contribute to overall success. To gain a better understanding and determine the change you need to drive to improve performance, it’s critical to assess the entire behavioral funnel. Assessing SDRs’ behaviors, actions, and their interconnectedness allows you to get a holistic view. By tracking and analyzing various input metrics, sales leaders can identify which behaviors are most effective in driving the desired outcomes and make informed decisions to improve performance.
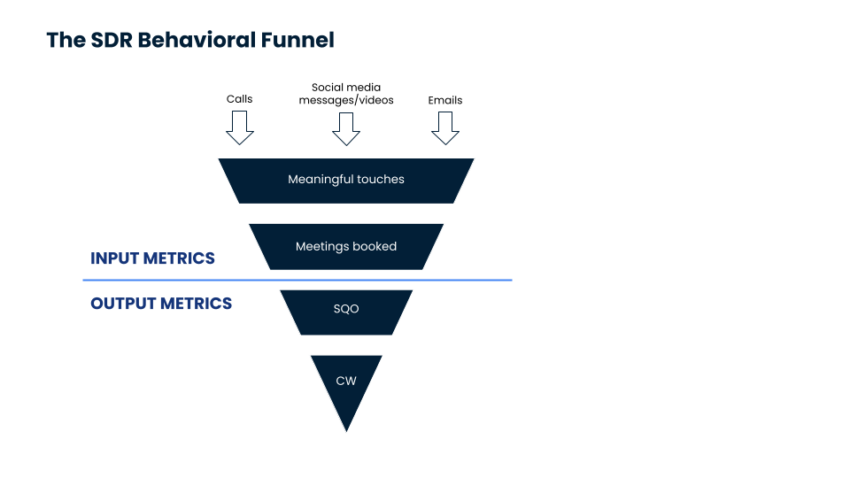
The SDR Behavioral Funnel

The behavioral funnel segments the activities of SDRs at the input level into three categories.
Initial touch points, encompassing outbound calls, emails, and social media activities initiated by SDRs, are the largest volume of data and are often scattered across various channels and tools.
It’s important to acknowledge that tracking this data can be challenging, particularly when SDRs use their personal LinkedIn or Instagram profiles, or messaging platforms like WhatsApp or WeChat, to connect with prospects. This decentralized approach may make some data points untrackable or challenging to capture in an automated fashion.
Even so, analyzing these data points — however imperfect — can provide you with an indicative overview of the types and volumes of activities your SDRs engage in. This analysis allows you to assess how your SDRs allocate their time among these activities, helping you understand their focus and productivity.
Some key metrics:
- Number of calls/emails/messages
- Number of unique sequences sent
- Number of completed tasks
- Number of tasks in queue
Meaningful contact involves activities where SDRs engage in two-way communication and interactions with prospects that capture their attention and generate interest in the offering. This can include conversations, emails, and interactions through social media.
As a sales leader, capturing as many meaningful activities as possible is valuable, even if some occur through social media platforms that may be more challenging to track. By comparing these metrics to the corresponding initial touchpoint metrics, you can assess which activities have the highest success rate in generating meaningful contacts with prospects. This comparison helps establish baselines and understand the effectiveness of different outreach strategies.
Call analysis tools, like Gong, can be valuable for analyzing SDRs’ calls within the critical 3 to 9-minute duration, where meaningful discovery often occurs. By comparing the number of successful calls in this timeframe to the total volume of calls, you can calculate the call success rate and set achievable goals for your SDRs. Additionally, comparing the number of monthly calls in this range with your SDRs quota gives you an insight into the quality of their discovery.
Ideally, you should see a ratio of 1:1.5, meaning that they are having 50% more meaningful conversations than their quota. This indicates that your SDRs are consistently engaging in valuable discovery conversations. Consider taking into account the conversion rate from demo booked to sales qualified opportunity to establish an appropriate ratio for your organization. For example, if your demo to SQO conversion rate is 80%, you would want your SDRs to have at least 20% more meaningful conversations than their quota.
Calculate the median call length and the median number of questions asked during meaningful calls to assess SDR performance further. This information can be tracked using specialized tools or trackers to help establish baselines for these metrics. Armed with these insights, you can provide targeted training and guidance to improve and optimize your SDRs’ performance in these areas.
By leveraging data and metrics related to meaningful contacts, you can gain valuable insights into the effectiveness of your SDRs’ interactions with prospects. This empowers you to take actionable steps to enhance your sales processes and ultimately drive better outcomes for your team.
Some key metrics:
- Number of calls between 3 and 9 minutes
- Average call length
- Number of questions asked during cold calls
- Email/message open and response rate
Meetings booked encompass the metrics that relate to the opportunities created by SDRs. This includes both quantitative and qualitative aspects, focusing on how SDRs manage the handoff to account executives and follow up on opportunities to ensure prospects attend and derive value from the demo.
From a quantitative perspective, tracking the amount of information SDRs provide to the account executives in the CRM is valuable. This can be done using checklists or similar mechanisms that enable efficient tracking at scale. By segmenting this information, sales leaders can gain insights into the volume and quality of data being transferred to AEs.
On a qualitative level, it’s important to delve deeper into how SDRs enrich their handover process. This includes capturing additional details about the prospect gathered during the call, specific pain points they identified, and any other relevant information that can help the account executive tailor the demo to meet the prospect’s specific needs. Focusing on these details empowers account executives (AEs) to have more successful and personalized conversations with prospects.
By analyzing both the quantitative and qualitative aspects of the handover process, which can be measured using trackers or by simply counting the number of words used in the handover message, you can effectively evaluate how well SDRs are qualifying opportunities so you can pinpoint areas for improvement and provide targeted training to enhance the quality and value of the handoff to AEs.
Understanding how metrics higher up in the behavioral funnel impact opportunity-level metrics is essential, as that’s where you often find the root cause. For instance, instead of immediately focusing on having SDRs write longer handover notes in the CRM, you may ensure that they are actually spending enough time on the phone, asking the right questions, and conducting effective discovery conversations. By addressing behaviors earlier in the funnel, you can make significant corrections that typically have a more substantial impact on overall performance.
Some key metrics:
- Opportunity completion rate
- Length of handoff notes (by word)
- Number of follow-up emails or calls
- No-show re-engagement activities
Segmenting SDRs’ behaviors and identifying corresponding input metrics is key to understanding the interconnectedness and consequences of their different actions. This segmentation enables sales leaders like you to identify areas where corrections and improvements will significantly impact performance.
Your Enablement Strategy
Working backward from the specific problem behaviors and understanding the cause-and-effect relationship between behaviors can help you define your goals and design a more effective enablement program that addresses the specific areas that need improvement. It’s important to carefully analyze the behavioral funnel and identify the key metrics that accurately reflect the desired outcomes. This way, you can track and assess the progress towards success. Just make sure you pick the right metrics in the first place!
Curious about partnering with RevGenius on events? Talk to us!